NJ Spotlight News

SUBSCRIBE
  • Watch
  • Healthcare
  • Education
  • Budget
  • Politics
  • Under the Dome
  • Archives
Interactive Map: Enrollment Data Shows Segregation Persists in NJ School System

Maps

Interactive Map: Enrollment Data Shows Segregation Persists in NJ School System

While New Jersey’s public school population is highly diverse overall, that is not reflected in most districts or schools

Colleen O'Dea | January 13, 2020
Interactive Map: Mail-in Ballots a Rising Trend in New Jersey

More than eight in 10 who voted by mail sent in their ballot by the end of October, a trend that could change campaign strategies

Colleen O'Dea | November 22, 2019
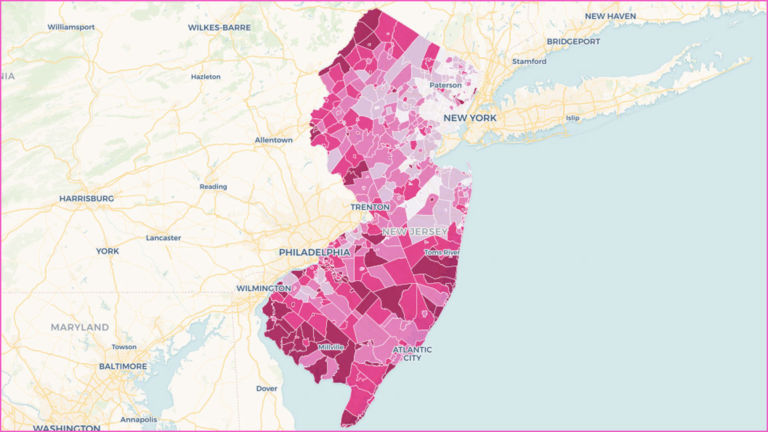
Interactive Map: Can Dems Translate Registration Edge into Assembly Seats?

The numbers are definitely in the Democrats’ favor, with nearly 980,000 more registered voters, but those advantages can fade when the Assembly tops the ticket
Colleen O'Dea | October 29, 2019
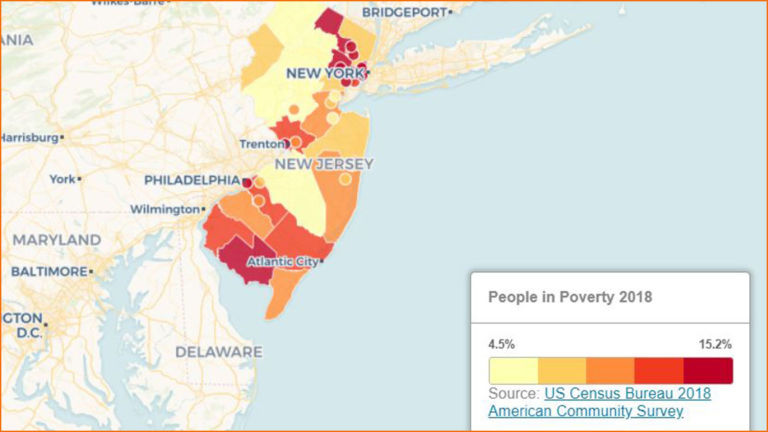
Interactive Map: Poverty in New Jersey in 2018 by County

The percentage of residents living in poverty dropped to 9.5% last year, the lowest in a decade, but still higher than before the Great Recession
Colleen O'Dea | October 9, 2019
Interactive Map: Educators’ Pay Rose 1% Last Year; Bigger Raises on the Way

Data show that typical public school teacher in New Jersey will receive a 3.01 percent raise this year, the biggest hike in many years
Colleen O'Dea | September 6, 2019
Interactive Map: Cost of Education in Each School District, 2017-2018

Typical NJ public school district spent almost $16,000 per pupil. Total cost of educating each child was 40 percent higher when spending on busing, pensions, ...

Colleen O'Dea | August 12, 2019
Interactive Map: Where ‘Crime Guns’ Have Been Recovered in New Jersey

Murphy administration compiles statistics to draw attention to its effort to hold manufacturers and dealers accountable
Colleen O'Dea | July 24, 2019
Interactive Map: New Jersey, Flush with Baby Boomers

New census data show increase in older population, influx of young families in Hudson River communities but declining population in farthest suburbs

Colleen O'Dea, Colleen O'Dea | June 20, 2019
Interactive Map: 2018 Graduation Rate, NJ’s Best in Recent Years

The rate rose for almost every category of graduate. And, after years of not reporting data by gender, 2018 results show girls graduated at higher ...

Colleen O'Dea | March 11, 2019
Interactive Map: The High, Low, and In Between of NJ’s Property Taxes

Taxes edged up by less than 1 percent in the past year, the smallest bump in decades, but the dollar amount homeowners actually pay is ...

Colleen O'Dea, Colleen O'Dea | February 28, 2019
Interactive Map: Stats Show Lack of Diversity in Front of NJ Classrooms

Numerous studies have shown the benefits of a diverse teaching force, both for students of color and for all pupils
Colleen O'Dea, Colleen O'Dea | February 15, 2019
Interactive Map: IRS Data Shows New Jersey Loses Out In Relocation Game

Mining the returns of those who have moved in and moved out, a report by the federal taxman pegs the Garden State as a net ...
Colleen O'Dea, Colleen O'Dea | January 18, 2019
Interactive Map: Internet and Computer Access Across NJ Reflects a Digital Divide

Smartphones, laptops, desktop computers, internet connections — poorer New Jerseyans are less likely to have them than better-off residents
Colleen O'Dea, Colleen O'Dea | December 11, 2018
Interactive Map: Teacher Salaries Grew More Last Year than in a Long Time

Average salaries for NJ public school teachers increased by just over 2 percent. Administrators saw somewhat bigger gains
Colleen O'Dea | November 21, 2018
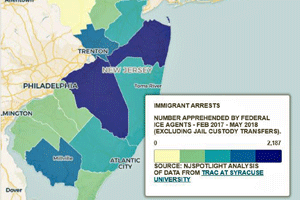
Interactive Map: ICE Arrests of Immigrants in NJ — Essex County in Nation’s Top Ten

Essex County is among hot spots in the country for arrests of immigrants by ICE agents. Sharp rise in New Jersey under Trump administration

Colleen O'Dea, Colleen O'Dea | October 26, 2018
Interactive Map: NJ Leans Blue, But Not Everyone Registered Goes to Vote

Trying to call the congressional contests is more of a challenge than ever — gender, education, wealth, age, and race must all be factored into ...

Colleen O'Dea, Colleen O'Dea | October 5, 2018
Interactive Map: NJ’s Election Spending, Where’s the Cash Coming from?

An unusually large number of competitive contests for New Jersey’s congressional seats, a Senate candidate with deep pockets, and funding from outside groups make for ...

Colleen O'Dea | September 17, 2018
Interactive Map: Eviction Filings Dip to Lowest Level in More than a Decade

Despite reductions, tenant advocates and attorneys claim a crisis still exists, especially in Essex County — particularly Newark — which saw more than 40,000 filings ...

Colleen O'Dea, Colleen O'Dea | August 3, 2018
Interactive Map: Where New Jersey’s Prison Population Is Shrinking Fastest

The Garden State leads the nation in freeing prisoners, a trend helped along by sentencing reform and changes in the way drug crimes are dealt ...

Colleen O'Dea, Colleen O'Dea | July 20, 2018
Interactive Map: Where Opioids Are Exacting the Highest Death Toll in NJ

Prescriptions are way down but that hasn’t halted the accelerating number of fatalities. The one bright spot is Ocean County, which has seen big decline ...

Colleen O'Dea, Colleen O'Dea | June 22, 2018
Interactive Map: Are We Seeing the Beginning of a Blue Wave in New Jersey?

The turnout for the midterm primaries was the highest in years, with Democrats showing up at the polls in greater numbers that Republicans in most ...

Colleen O'Dea, Colleen O'Dea | June 8, 2018
1 … Older
  • Archives
  • NJ Decides 2026
  • Under the Dome
  • Budget
  • Business
  • Education
  • Energy & Environment
  • Healthcare
  • Politics
  • Social Issues
  • Opinion
  • Coronavirus
  • Transportation
  • Immigration
  • Housing
  • Planning
  • Roundtables
  • Podcasts
  • About
  • Frequently asked questions
  • Team
  • Contact us
  • Where to watch
  • Privacy information
  • NJ PBS
  • Give to NJ PBS
  • NJ Spotlight News podcast archive

SUBSCRIBE

©2026 NJ SPOTLIGHT NEWS. All Rights Reserved.

NJ Spotlight News is part of NJ PBS at Montclair State University.

NJ Spotlight News
Connect on Social:
NJ Spotlight News
  • NJ Decides 2026
  • Under the Dome
  • Budget
  • Business
  • Education
  • Energy & Environment
  • Healthcare
  • Immigration
  • Politics
  • Law & Public Safety
  • Social Issues
  • Opinion
  • More Issues
  • Sponsored Content
  • About
    • Frequently asked questions
    • Team
    • Contact us
    • Where to watch
    • Privacy information
  • Archives
    • Video episodes
    • NJ Spotlight News podcast

Connect on Social

Subscribe to our Newsletter

SUBSCRIBE